Galactic Chemical Evolution
Stellar abundance patterns encode the nucleosynthetic history of the Milky Way. One-zone Galactic chemical evolution (GCE) models can reproduce average abundance trends, but the observed scatter remains challenging. While dynamics is often invoked as the main source of dispersion, an alternative — and complementary — explanation is that different stellar yield prescriptions may contribute simultaneously. We test this hypothesis in the following project.
Assessing Stellar Yields in Galaxy Chemical Evolution
Liang, J., Gjergo, E., & Fan, X. (2023), MNRAS, 522, 863–884. [ADS] [arXiv]
Motivation
GCE models rely on stellar yields — the mass of each chemical species ejected by stars of different masses, metallicities, and evolutionary channels — as a primary input. Multiple yield tabulations exist in the literature for each enrichment channel (low-to-intermediate mass stars, massive stars, Type Ia supernovae), and they often disagree significantly due to different assumptions on hypernovae fractions, stellar rotation, and explosion mechanisms. The question we address is: can the observed scatter in the [X/Fe]–[Fe/H] diagram be partially explained by the coexistence of multiple yield prescriptions, rather than invoking dynamics alone?
Approach
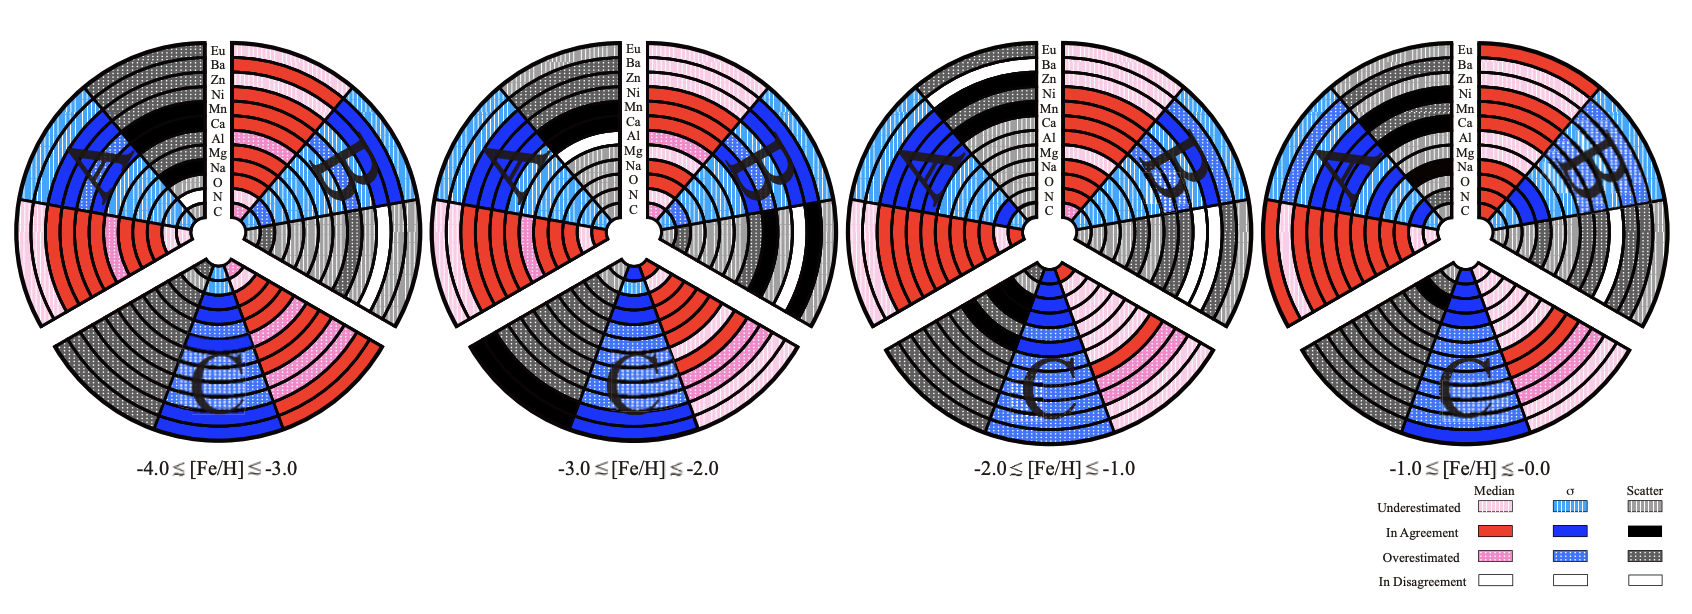
We compile observational stellar abundances for 12 elements (C, N, O, Na, Mg, Al, Ca, Mn, Ni, Zn, Ba, Eu) from stars in the Galactic halo, thick disc, and thin disc, spanning \(-4 < \mathrm{[Fe/H]} < 0\). We then run 16 one-zone GCE models using the OMEGA module within the NuPyCEE framework, keeping all parameters fixed (star formation rate, IMF, inflow/outflow) except the stellar yield tables. The 16 models are organised into three groups based on the dominant source of yield variation: Group A varies the hypernovae fraction in massive star yields (Kobayashi et al. 2006; Nomoto et al. 2013); Group B varies the rotational velocity of massive stars (Limongi & Chieffi 2018); and Group C explores fast- versus delayed-convection explosion prescriptions (NuGrid, Ritter et al. 2018). We define statistical criteria comparing the median, standard deviation, and scatter of models against the data in four metallicity bins.
Main Results
1. Yields show large variations for massive stars
For low-to-intermediate mass stars and Type Ia supernovae, different yield tabulations produce broadly consistent results. However, for massive stars, the yield mass-fraction varies by orders of magnitude depending on the modelling assumptions — particularly for elements heavier than the iron peak (Ba, Eu) and for light elements (C, N, O) at the 10–30 \(M_\odot\) range. This makes the choice of massive star yields the dominant source of model uncertainty.
2. Individual groups reproduce medians but not scatter
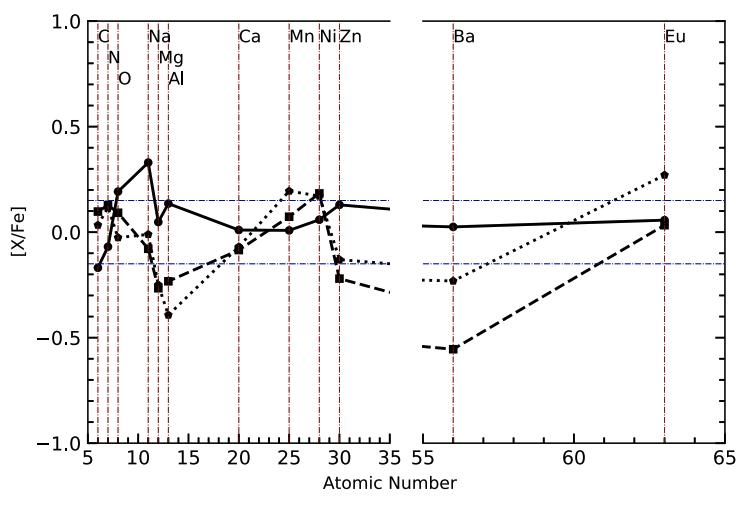
Each yield group can reproduce the median [X/Fe]–[Fe/H] trends for most elements up to Zn. However, no single group can match both the observed scatter and standard deviation. Group A best reproduces the median at all metallicities, Group B reproduces roughly half the data, and Group C performs well at low metallicities but underestimates abundances at \(-2.0 \lesssim \mathrm{[Fe/H]} \lesssim 0.0\). The figure below shows the [X/Fe]–[Fe/H] relation for C, N, and O, illustrating how the three groups span different regions of the abundance plane.
![[X/Fe]-[Fe/H] relations for CNO elements](/assets/images/project-GCE/fig5.png)
3. Present-day abundance ratios reveal systematic offsets
Evaluating the predicted present-day [X/Fe] at solar [Fe/H] for all 12 elements, we find that the best-performing model from each group reproduces most elemental abundances to within \(\pm 0.15\) dex of solar values, but with characteristic offsets: Group A tends to underestimate C and overestimate Na; Group B underestimates Mg and Al; and Group C overestimates Mn, Ni, and Eu.
4. Combining groups improves coverage but cannot fully explain the scatter
When combining two or three groups, the fraction of reproduced data scatter increases, and the underestimated standard deviation is reduced. However, the combined models also increase the fraction of overestimated scatter and standard deviation, particularly at \(-2.0 \lesssim \mathrm{[Fe/H]} \lesssim 0.0\). This means that a simple averaging or superposition of yield prescriptions cannot fully account for the observed abundance scatter — a realistic mixing of yields requires time- and metallicity-dependent weighting, which goes beyond the scope of one-zone models.
5. Neutron-capture elements are the least well reproduced
Ba and Eu exhibit the most significant tension between models and data. Our models include neutron star mergers (NSM) as the sole r-process channel, which is insufficient to explain the observed Eu enhancement at low metallicities. This highlights the need for additional r-process production channels such as collapsars or magnetohydrodynamic jets. Further details on individual elemental groups (CNO, \(\alpha\) and odd-Z, iron-peak, neutron-capture) and the full statistical analysis are presented in the paper (Sections 3.1–3.5).
Summary
We show that while many yield prescriptions are effective at reproducing median Galactic abundance trends, the observed scatter in stellar abundance patterns cannot be explained solely by the simultaneous application of different yield prescriptions. The abundance scatter is likely driven by varying physical or dynamical properties of the local environment rather than by the coexistence of multiple nucleosynthetic mechanisms alone. Among the three dominant enrichment channels, massive star yields exhibit the largest model-to-model variations, making them the primary source of theoretical uncertainty. Neutron-capture elements remain the least well reproduced, calling for exploration of alternative r-process channels beyond neutron star mergers.