Galaxy–Halo Connection
How do the structural properties of dark matter (DM) halos shape the morphologies of the galaxies they host? This series of papers works toward a comprehensive, quantitative answer — developing new tools for kinematic morphological decomposition, measuring an exhaustive set of halo structural parameters, and applying statistical regression methods to uncover the complex, multi-dimensional relationships between galaxy morphology and halo structure.
Paper I: A Running Threshold for Thin Discs and Size Predictors from the Dark Sector
Liang, J., Jiang, F., Mo, H., Benson, A., Dekel, A., Tavron, N., Hopkins, P. F., Ho, L. C. 2025, MNRAS, 541, 2304. [ADS] [arXiv] [Code: MorphDecom]
Motivation
Galaxies exhibit dramatic morphological diversity — spanning two orders of magnitude in size at fixed stellar mass, ranging from large bulgeless discs to compact ellipticals. Understanding this diversity in terms of host DM halo properties is a central question in galaxy formation theory. However, progress has been hindered by a fundamental methodological problem: most existing kinematic decomposition schemes rely on fixed, arbitrary thresholds in orbital circularity to separate thin discs, thick discs, bulges, and stellar haloes. Different authors use different values, making comparisons across simulations or redshifts unreliable.
A New Morphological Decomposition Scheme
We introduce a new, minimally arbitrary morphological decomposition pipeline applied to the TNG50 cosmological simulation. Our method builds on the energy-based framework of Zana et al. (2022) — detecting a physically motivated local minimum in the binding energy distribution to separate the stellar halo from the inner galaxy — and significantly improves upon it by replacing the constant circularity threshold for disc separation with a data-driven approach. Specifically, we apply the Gaussian Mixture Models (GMM) algorithm in the 3D space of orbital circularity \(\eta\), polarity \(\epsilon\), and normalized binding energy \(e_b\) to robustly identify the intersection point between the thin and thick disc populations. This intersection, \(\eta_\mathrm{cut}\), emerges from the data itself rather than being imposed by hand.
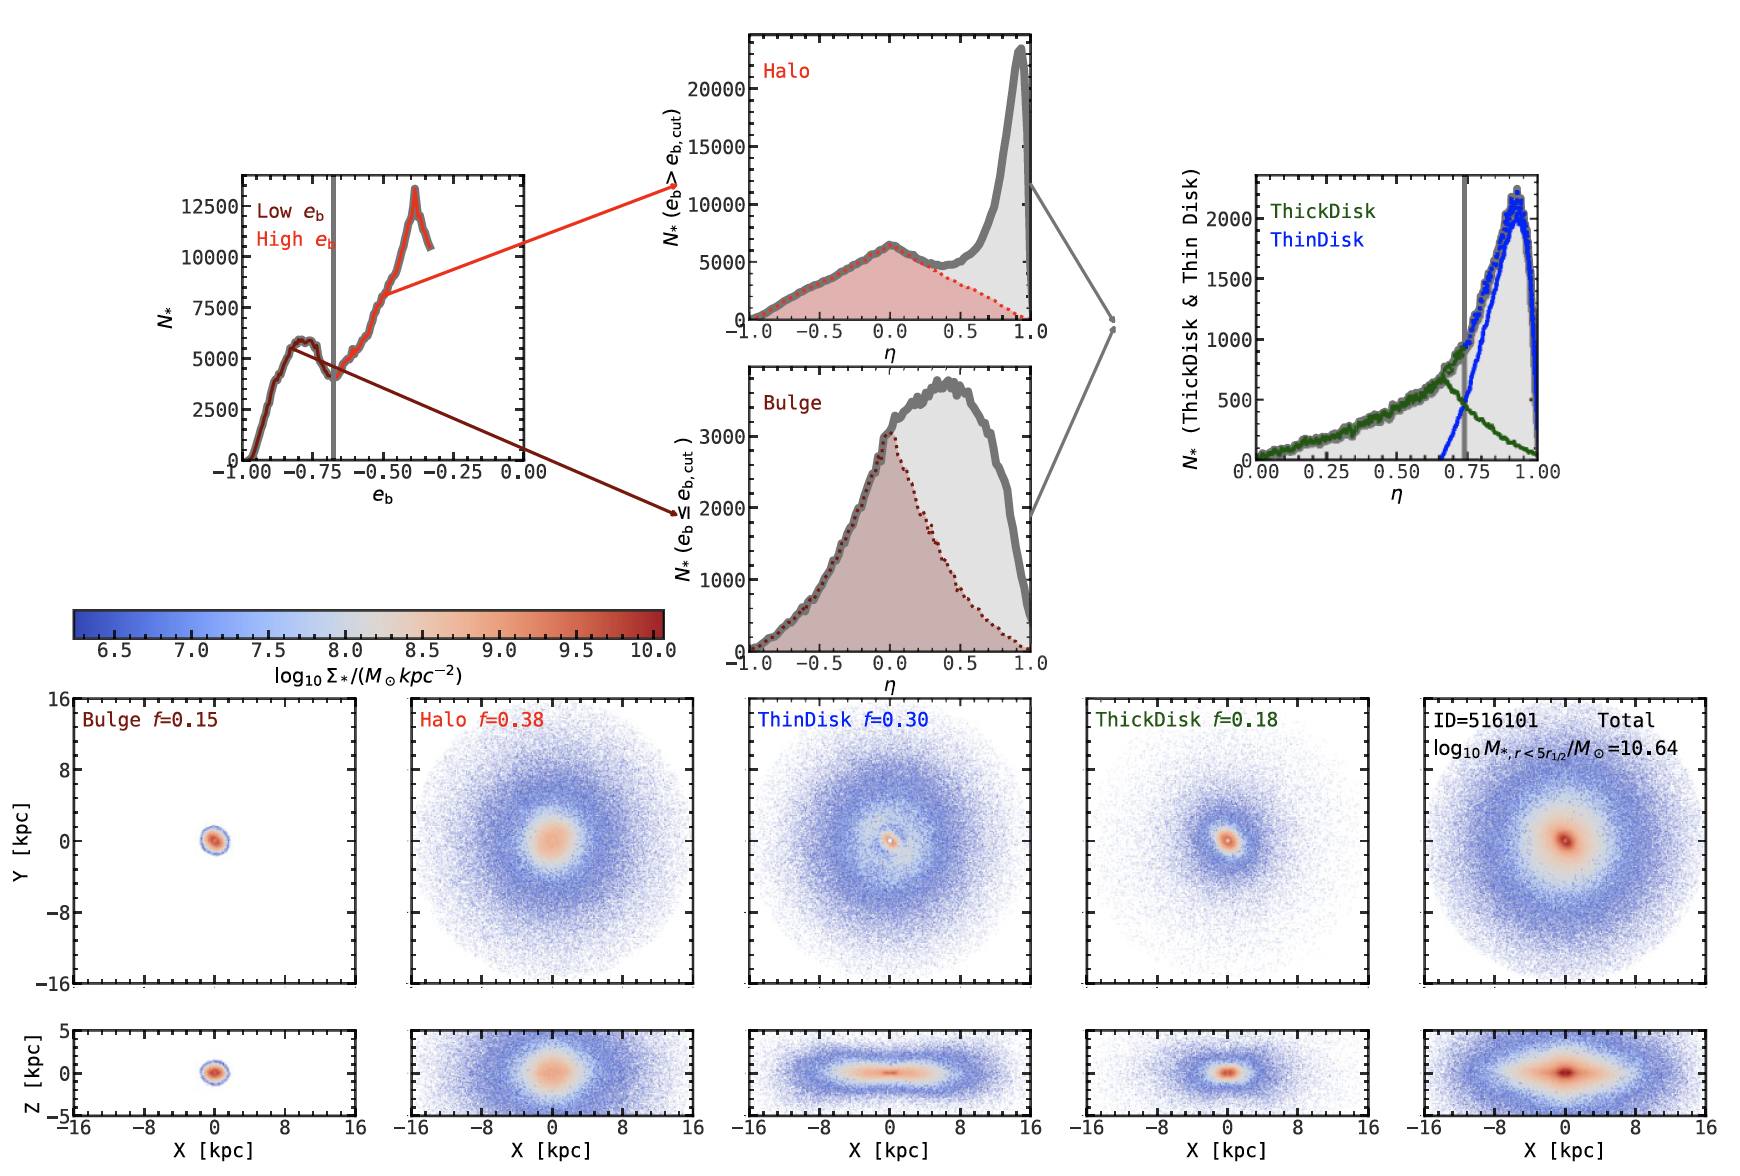
A Characteristic Mass Scale for Disc Settlement
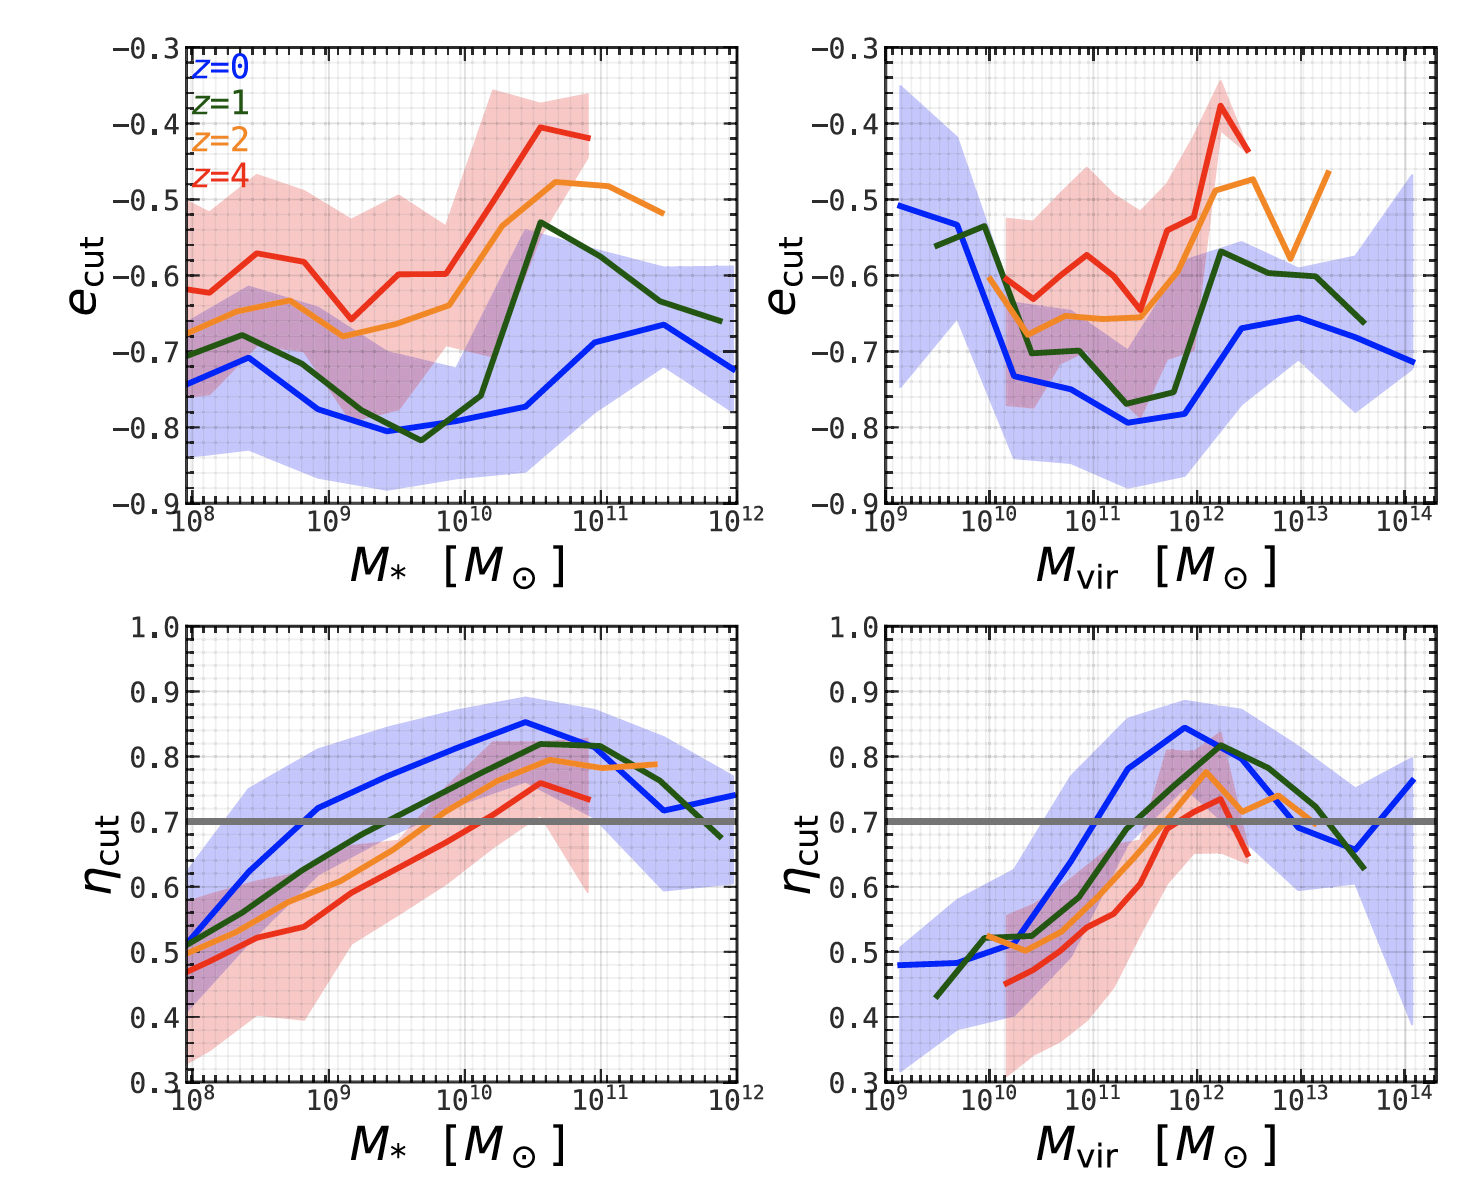
A key finding from applying this method across the full TNG50 sample at \(z = 0, 1, 2, 4\) is that both the energy threshold \(e_\mathrm{cut}\) and the circularity threshold \(\eta_\mathrm{cut}\) vary systematically with halo mass and redshift — they are not constants. Strikingly, \(\eta_\mathrm{cut}\) peaks near the Milky Way halo mass scale (\(M_\mathrm{vir} \sim 10^{12}\,M_\odot\)), nearly independently of redshift. This mass scale coincides with the characteristic mass at which cosmological simulations predict disc settlement via gas-rich compaction (Dekel et al. 2020), and our large statistical sample of TNG50 confirms and extends this picture. Using a constant \(\eta_\mathrm{cut} = 0.7\) — as is standard in the literature — systematically overestimates the thin disc fraction for Milky Way-mass galaxies and underestimates it for dwarfs, especially at high redshift.
Galaxy Size and Its Halo Predictors
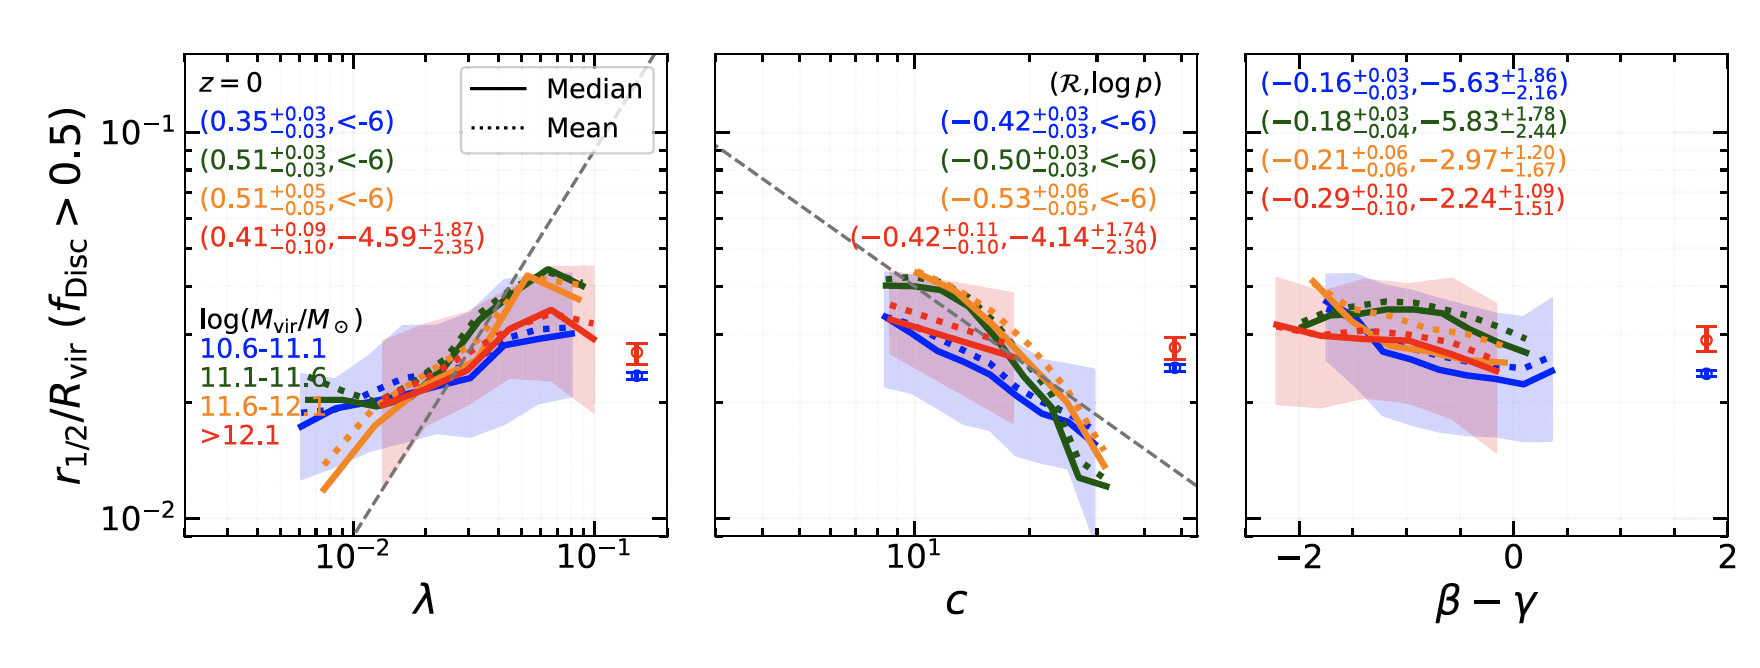
Beyond morphological decomposition, we revisit the question of which DM halo properties best predict disc size. Focusing on disc-dominated galaxies (\(f_\mathrm{disc} > 0.5\)) in TNG50, we find that the half-mass radius \(r_{1/2}\), normalised by the virial radius \(R_\mathrm{vir}\), correlates with three secondary halo parameters beyond virial mass: a positive correlation with halo spin \(\lambda\) (stronger than found in higher-resolution zoom-in simulations, but weaker than the classical \(r_{1/2} \propto \lambda R_\mathrm{vir}\) scaling), an anticorrelation with halo concentration \(c\) (captured approximately by a \(c^{-0.7}\) scaling), and a weaker positive correlation with the mass accretion rate parameter \(\beta - \gamma\). The concentration dependence is not purely a baryonic effect — it persists even when concentration is measured from the matched dark-matter-only simulation, at least for dwarf-mass systems.
We also find that disc mass fraction \(f_\mathrm{disc}\) correlates positively with the DM halo 3D axis ratio \(q\) — more spherical, relaxed halos host more disc-dominated galaxies — and that disc development is enhanced in denser cosmic-web environments (knots and filaments), consistent with the need for both a stable gravitational environment and a continuous gas supply. The decomposition pipeline is publicly available at MorphDecom.
Paper II: Predicting Disk Structure from Dark-Matter Halo Properties
Liang, J., Jiang, F., Mo, H., Benson, A., Hopkins, P. F., Dekel, A., Ho, L. C. 2026, Accepted by ApJ. [ADS] [arXiv] [Code: Symbolic Regression Pipeline]
Motivation
Paper I established correlations between individual halo properties and disc size. But which combination of halo properties is most predictive overall? Can disc thickness — a quantity less previously linked to halo properties — also be inferred from the dark sector? And can we derive simple, accurate empirical formulae that semi-analytical galaxy formation models can directly use? Paper II addresses all of these questions, leveraging a comprehensive set of 37 halo structural parameters and a suite of regression tools.
Analysis Framework
Using the morphological decomposition developed in Paper I, we measure 9 disc structural quantities — scale radii, scale heights, and mass fractions of the total, thin, and thick disc — for TNG50 galaxies across \(0 \leq z \leq 4\). We pair these with 37 halo properties measured from both the full-physics (hydro) and matched dark-matter-only (DMO) simulations, spanning density structure (concentration, Einasto shape index), angular momentum (global and inner spin), 3D shape, mass assembly history (MAH), and large-scale environment. A three-stage analysis pipeline is then applied: Random Forest (RF) regression to assess raw predictability, SHAP analysis to identify and rank the most influential halo parameters, and Symbolic Regression (SR) via PySR to derive compact analytic expressions.
Key Results
1. Disc properties are highly predictable from halo parameters alone
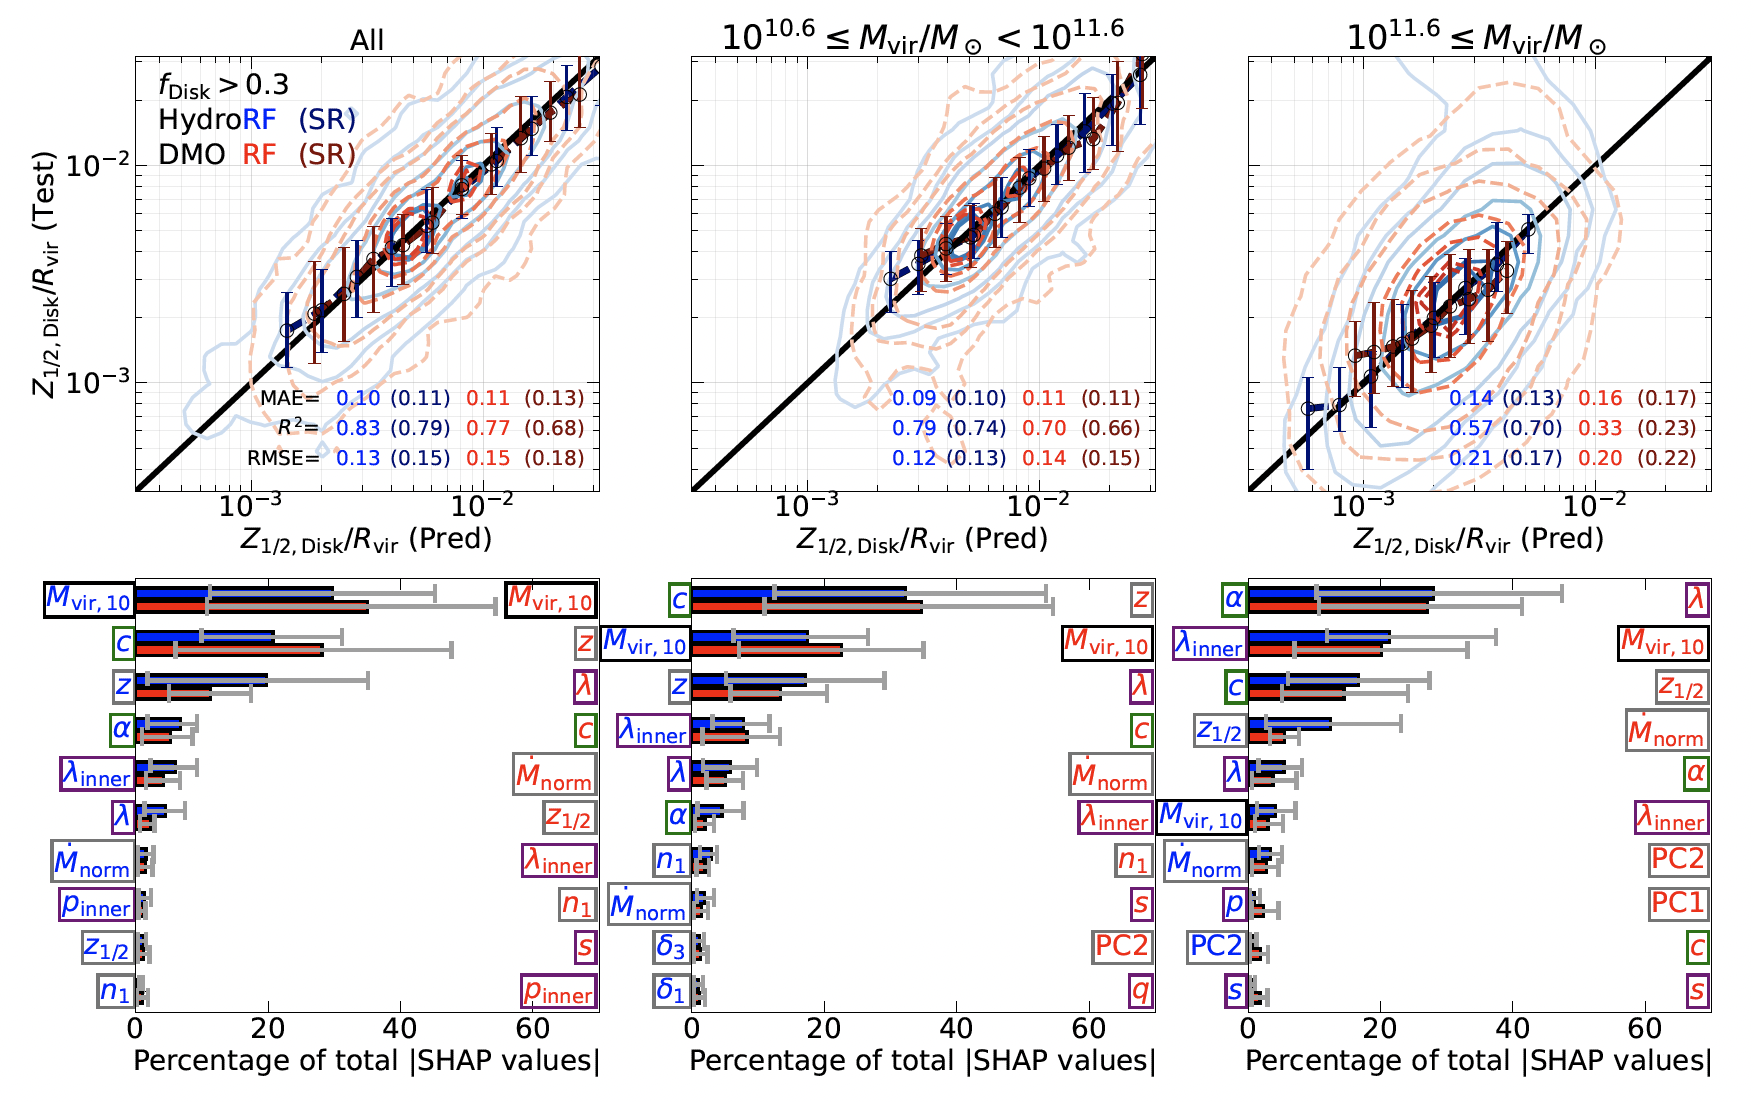
RF regression achieves \(R^2 = 0.63\) for disc half-mass size and \(R^2 = 0.83\) for disc scale height, using halo properties from the hydro simulation — the latter being a remarkable result, as disc height has never previously been linked to halo properties. Lower-mass halos (\(M_\mathrm{vir} < 10^{11.6}\,M_\odot\)) yield higher prediction accuracy than massive halos. Predictions based on hydro halo measurements consistently outperform those from DMO halos, reflecting the imprint of baryonic processes on the inner halo structure.
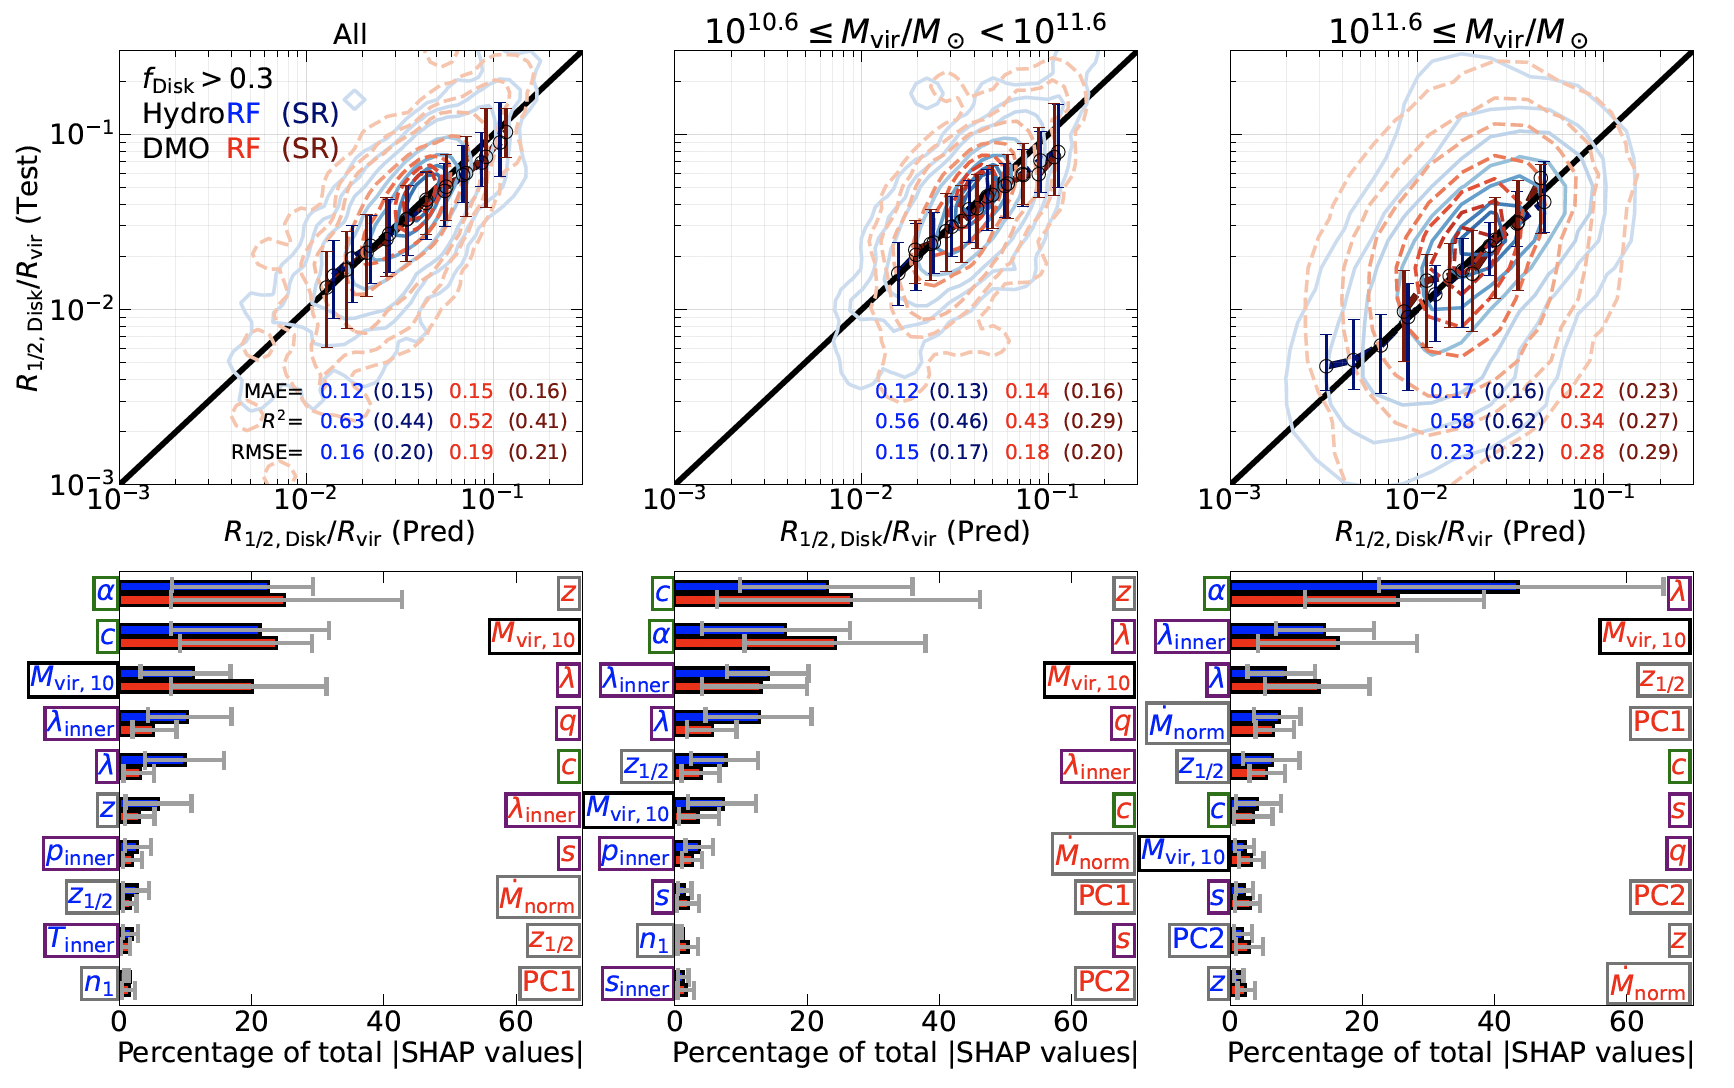
2. The most important halo parameters for disc structure
SHAP analysis reveals that different aspects of disc structure are regulated by different halo properties. For disc compactness (half-mass size), the most informative parameters are halo concentration \(c\), Einasto shape index \(\alpha\), inner-halo spin \(\lambda_\mathrm{inner}\), and global spin \(\lambda\). For disc scale height, halo mass and redshift dominate, followed by concentration and spin. Notably, \(\alpha\) is highly predictive only when measured from the hydro simulation — in the DMO run, it carries almost no predictive power — revealing that the apparent connection between disc size and \(\alpha\) arises from baryonic restructuring of the inner halo rather than a primordial link. When the disc is more extended, it causes more halo contraction, driving \(\alpha_\mathrm{hydro}\) lower relative to \(\alpha_\mathrm{DMO}\).
3. New SR-based size predictors outperform all previous relations
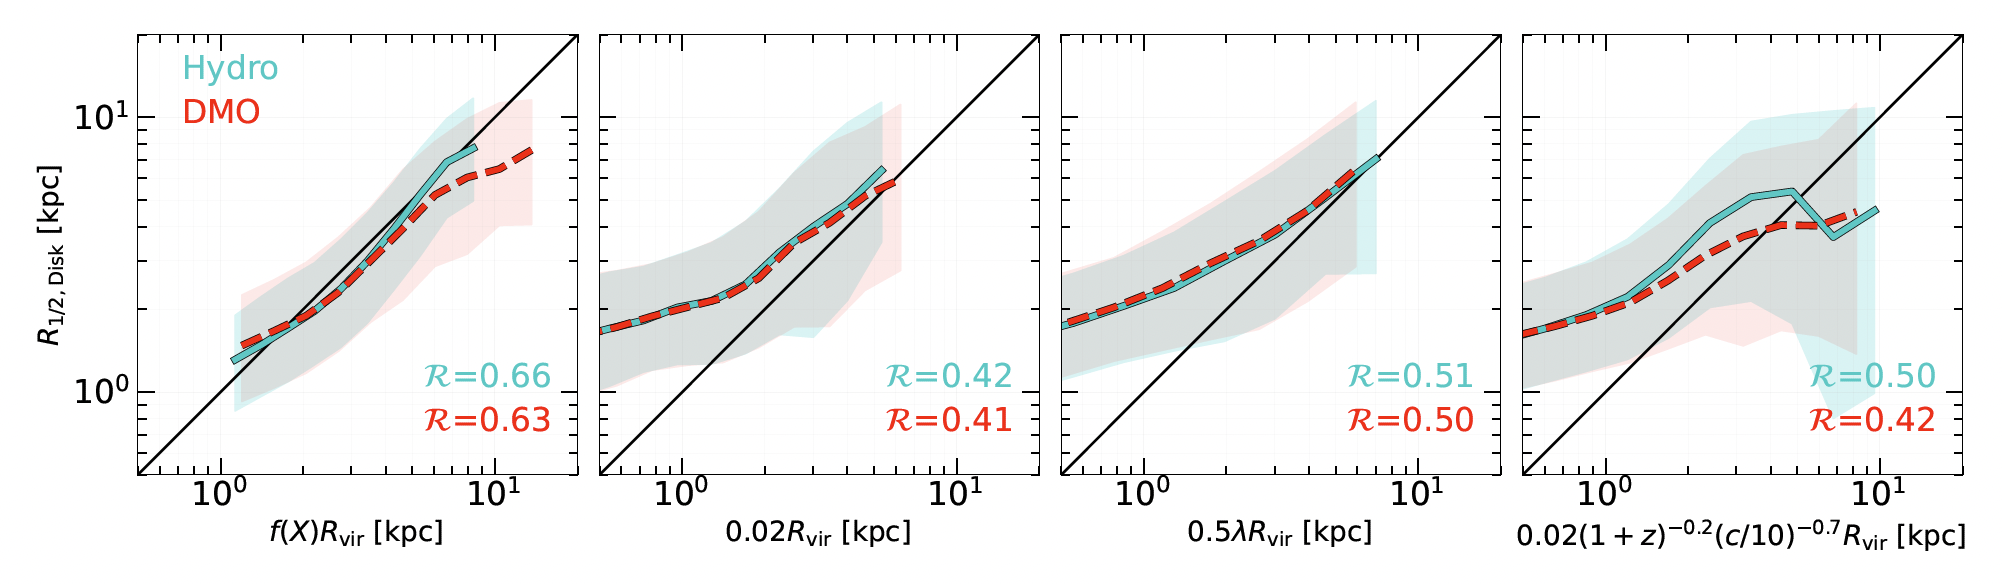
SR produces compact empirical formulae mapping halo parameters to disc properties. These new prescriptions achieve Spearman correlation coefficients of \(\mathcal{R} \gtrsim 0.6\) for disc size — significantly higher than the classical Mo et al. (1998) spin-based model (\(\mathcal{R} \sim 0.5\)), the Kravtsov (2013) \(r_{1/2} = 0.02 R_\mathrm{vir}\) scaling (\(\mathcal{R} \sim 0.4\)), and the Jiang et al. (2019) concentration-based model (\(\mathcal{R} \sim 0.5\)). The SR relations exhibit substantially reduced scatter and lie much closer to the 1:1 line, especially for compact discs where previous prescriptions systematically overpredict size.
4. Disc compactness shows a mass-dependent redshift evolution
Low-mass halos (\(M_\mathrm{vir} \lesssim 2 \times 10^{11}\,M_\odot\)) show a strong increase in disc compactness \(R_{1/2}/R_\mathrm{vir}\) towards high redshift — from \(\sim 0.02\) at \(z = 0\) to \(\sim 0.08\) at \(z = 4\). This can be understood because the physical star-forming radius stays roughly constant while the virial radius shrinks rapidly with increasing redshift, driven by the rising critical density of the Universe. In contrast, massive halos show the opposite trend: at high redshift, frequent gas-rich mergers and concentrated starbursts produce compact stellar components, so the disc size relative to the halo is actually smaller at high \(z\). These contrasting trends reveal that disc compactness encodes qualitatively different physics in the low-mass and high-mass regimes.
5. Disc thickness is primarily driven by halo mass and assembly history
Discs are thinnest — most flattened relative to their virial radii — near the Milky Way mass scale (\(M_\mathrm{vir} \sim 10^{12}\,M_\odot\)), and thicken toward both lower and higher masses. At any fixed mass, discs are systematically thicker at higher redshift. More recently and rapidly accreting halos host thicker discs at all redshifts, consistent with disc heating by mergers and accretion events. Disc height and disc size are tightly correlated, implying that the halo parameters setting the radial extent of the disc also regulate its vertical thickness. This explains why halo properties predict disc height even more accurately than disc size.
Empirical Prescriptions
All SR-based analytic prescriptions for stellar mass, SFR, galaxy size, disc size, disc height, and disc mass fraction — for both hydro and DMO halos — are provided in Tables A.1 and A.2 of the paper, and are available at this GitHub repository. These offer computationally efficient tools for semi-analytical and empirical models wishing to populate DM haloes with realistic galaxy morphologies.